
 0
0Gold & Silver Surge: Iran, Tariffs & BRICS Shake the Tape
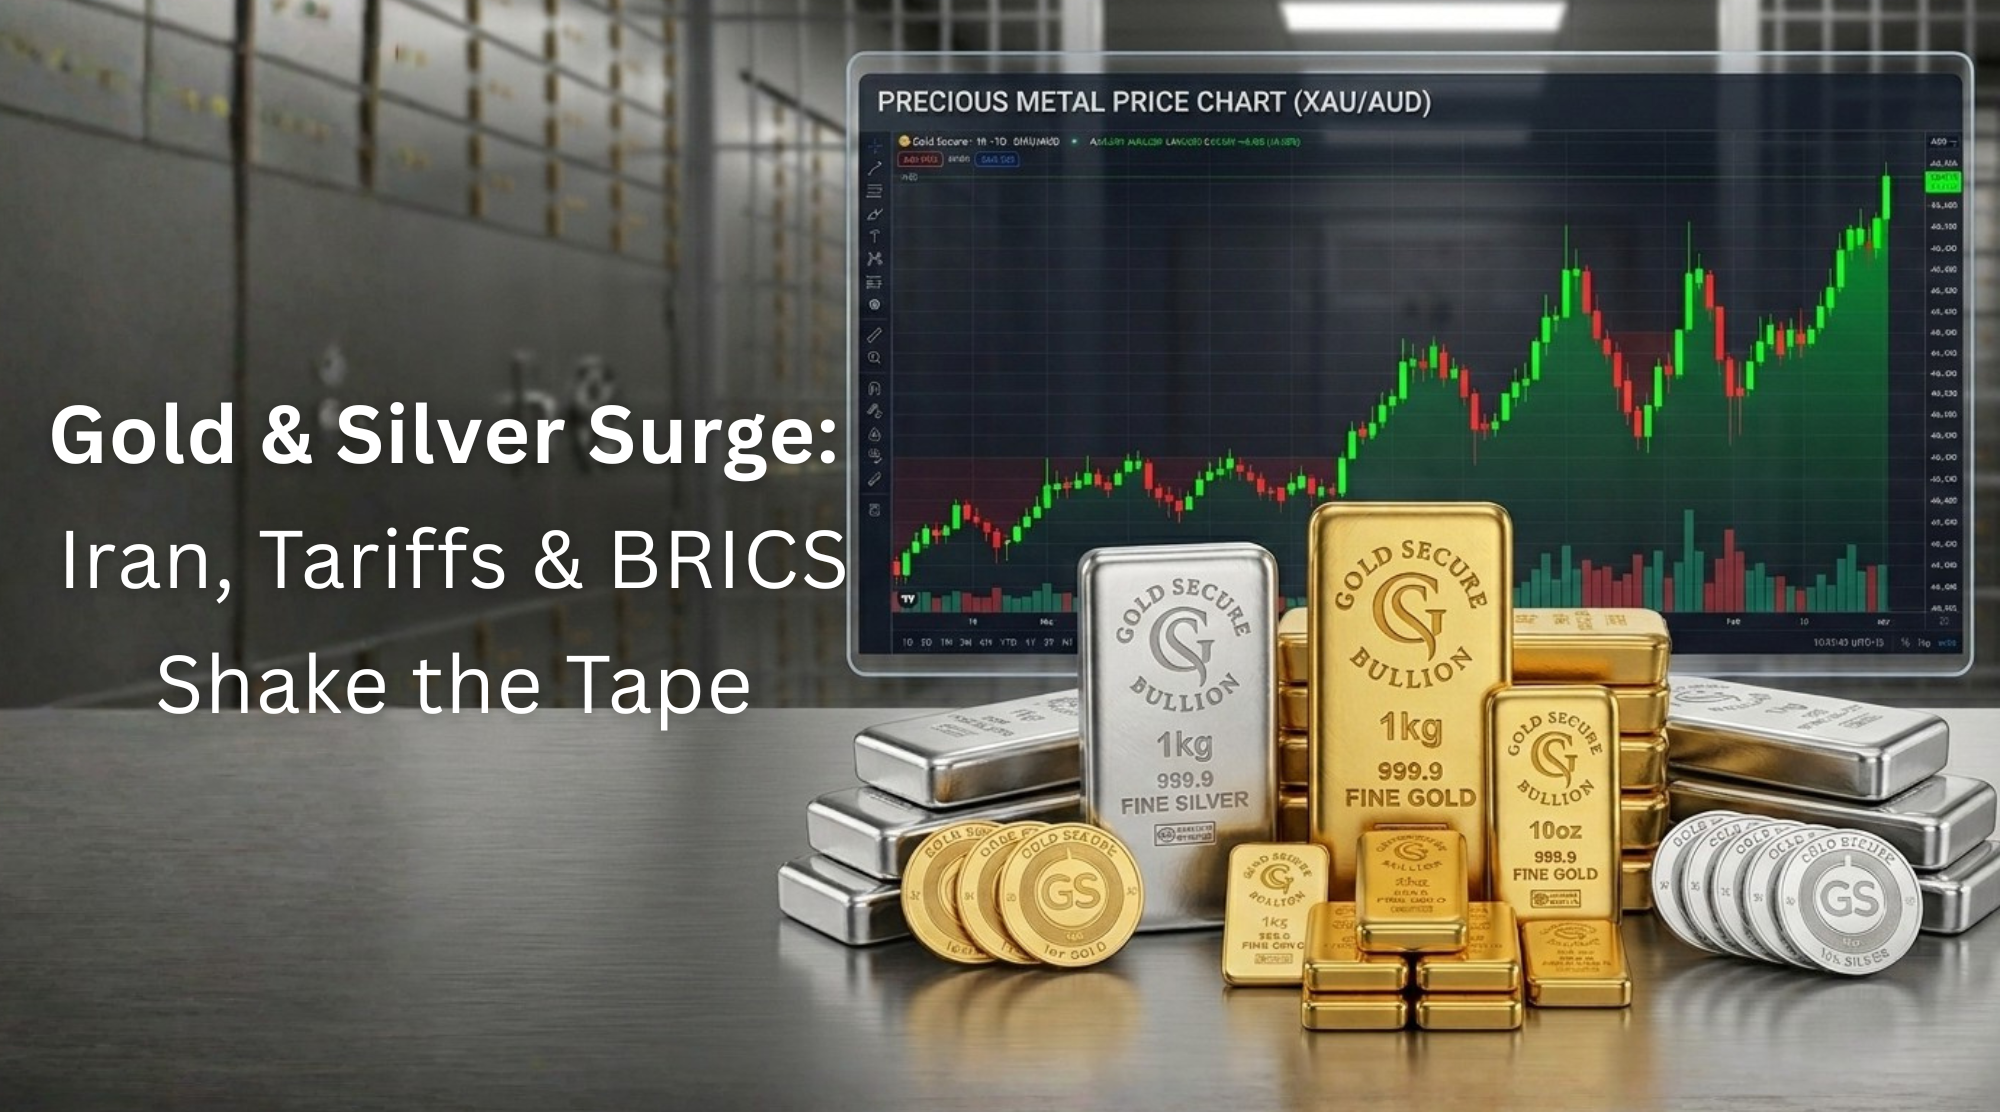
It’s been one of those weeks where the precious‑metals market isn’t just reacting to charts – it’s reacting to headlines. Gold has crept up into the mid‑A$7,000s per ounce, while silver has punched into the low A$120s, and none of that is happening in a vacuum. When you zoom out, the price moves line up almost perfectly with three big forces: rising tension with Iran, chaos around US tariffs, and a slow but steady shift in the global monetary system.
Where prices sit now
Let’s anchor the story quickly, then get back to the “why”. As of today, dealers are quoting gold around A$7,400 per ounce, with Silver trading in the low A$120s per ounce, with recent prints around A$122–125 depending on the feed.
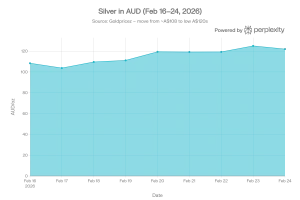
Compared with mid‑February, that puts gold up from roughly A$7,060 per ounce and silver up from around A$108 per ounce – a solid move in just over a week, especially on the silver side where you’re looking at a double‑digit percentage jump. With that context in place, the more interesting question is what’s actually pushing those numbers around?

Iran, oil and the “geopolitical premium”
The first and loudest driver has been Washington–Tehran tension. Over the past fortnight, gold reclaimed and then pushed above the US$5,000 mark as traders reacted to the risk of a drawn‑out confrontation, with safe‑haven flows sending the metal about 2% higher in a single session. US national‑security officials have been meeting in the White House Situation Room, military assets are being shifted closer to the region, and talks in Geneva have been described as “making progress but still far apart” on key issues like sanctions and uranium enrichment.
When markets hear “possible strikes” and “weeks‑long operation”, they start pricing in what commentators call a geopolitical risk premium – an extra layer of demand for assets that are seen as outside the political system. In practice, that’s one of the key reasons why gold has climbed from the low‑A$7,000s earlier this month into the A$7,300–7,400 range today, and why silver is no longer sitting quietly in the A$120‑something bracket.
Tariffs, courtrooms and a one‑day silver spike
The second shock came not from the battlefield but from the courtroom. The US Supreme Court struck down President Trump’s earlier broad emergency tariffs in a 6–3 decision, raising the prospect of more than US$175 billion in refunds and ripping up a major plank of his trade strategy. Within hours, the administration fired back with a new global tariff order – initially pitched around 10% with talk of 15% on the table – throwing fresh uncertainty over global trade flows.
Silver felt that immediately. On the day the ruling landed, the metal jumped almost 9%, its biggest one‑day gain since the last major crash. Analysts and community commentators linked the surge directly to the tariff shock, combined with soft US GDP at 1.4% and stickier‑than‑expected 0.4% PCE inflation, all landing alongside Iran headlines. Translate that and you see silver move from the low‑A$110s to the high‑A$110s and then on to roughly A$119–120 by Friday, before grinding into A$120s.
The slow burn: BRICS, de‑dollarisation and central bank buying
Beneath the fireworks, there’s a much slower story unfolding that helps explain why gold, in particular, has found a new “normal” around these higher levels. Central banks – especially in emerging markets – have been adding more than 1,000 tonnes of gold a year since 2022, while the US dollar’s share of global reserves has slipped to a 30‑year low. BRICS countries have doubled their combined gold reserves since 2020, amassing more than 6,000 tonnes, and are openly discussing gold‑backed trade arrangements and alternative payment systems to sidestep the dollar.
For markets, that sends a clear signal: gold is no longer just a crisis hedge, it’s becoming a core building block of a more multipolar monetary system. That structural demand is one reason the metal has been able to step up from the A$6,700–7,000 range last year into the A$7,000–7,400 band now, and why pull‑backs have been relatively shallow compared with the size of the rally over 2025–26.
Data, the Fed and the US Effect
Overlaying all this is an awkward macro backdrop in the US. Growth has cooled, with recent GDP figures printing at 1.4% annualised for the December quarter, while PCE inflation – the Federal Reserve’s preferred gauge – came in at 0.4% month‑on‑month, hinting that price pressures aren’t fully tamed. Fed minutes show policymakers keen to keep options open, and market odds of a mid‑year rate cut have wobbled as traders debate whether the next move is a cut, a hold, or something in between.
Gold and silver care less about the exact policy meeting and more about the broader direction of real yields and the US dollar. Analyses of the 2025–26 run highlight the combination of falling real‑yield expectations, a softer US dollar and strong commodity demand as key tailwinds for metals.
Silver’s personality: same story, bigger mood swings
One of the reasons silver can feel “too hot” week‑to‑week is simply how it trades. While gold is still seen as the core monetary metal, silver wears two hats – part safe haven, part industrial workhorse – so it reacts both to geopolitical fear and to any shifts in growth or manufacturing sentiment. Over 2025, silver outpaced gold in percentage terms as falling yields, tariff policies and supply concerns pushed investors into anything with a metal ticker, and that high‑beta character has carried into 2026.
Technical outlooks from institutional desks still frame silver as being in a broader uptrend, but with much higher volatility than gold – meaning sharp 8–10% down weeks followed by equally violent reversals, like the 9% spike seen on the tariff‑ruling day. It’s a good reminder that while both metals respond to the same forces – Iran, tariffs, Fed policy, BRICS – silver tends to exaggerate the move rather than quietly track it.
Copper, commodities and the bigger cycle
It’s also worth noting that gold and silver aren’t moving in isolation. Copper has been grinding higher on the back of long‑term demand from electrification, AI infrastructure and tight mine supply, recently challenging and breaking through key resistance levels in what analysts describe as a new bullish phase. Historically, when copper begins to outperform after a period of gold‑led strength, it often signals a broader commodity up‑cycle where growth, infrastructure and currency factors all pull in the same direction.
In that setting, gold often acts as the monetary anchor, silver plays the high‑beta bridge between “money” and “industry”, and copper reflects underlying economic momentum. Seeing all three pushing higher – albeit with different personalities and timeframes – fits neatly with the story of tariffs, Iran risk, de‑dollarisation and shifting central‑bank behaviour.
Bringing it together
So if you strip away the price noise and look at the story, this week in precious metals is really about three overlapping themes: conflict risk in the Middle East, legal and political shocks to the global trade framework, and a long‑running rethink of how the world stores value at the central‑bank level. Gold’s climb into the A$7,000–7,400 zone and silver’s jump into the A$128‑plus band are simply the visible footprints of markets trying to price those risks in – sometimes slowly, sometimes in 9% daily bursts.