
 0
0Why Gold Held Firm When the War Headlines Got Worse
On Wednesday, 6 May, the White House confirmed it was closer to a formal agreement with Iran than at any point since the war began. Oil fell nearly 7% across the week. Gold climbed to a two-week high of A$6,546. Silver moved harder and faster. But the real story was Thursday, when an escalation headline arrived, and gold did not blink. Here is what that reveals about where the precious metals market actually stands.
The Closest Thing to a Deal Since the War Began
When reports emerged on Wednesday, 6 May, that the White House was nearing a formal peace agreement with Iran, the market reaction was immediate. Oil dropped nearly 7% across the week. The US dollar softened. Gold climbed from A$6,370 at the start of the week, through A$6,480 on Wednesday, to a week high of A$6,546 on Thursday. Silver moved even harder.
The proposal on the table was substantive. Iran would accept enhanced UN inspections, halt nuclear enrichment for 12 to 15 years, potentially transfer highly enriched uranium overseas, and limit underground facilities. In return, the US would gradually lift sanctions and unfreeze Iranian assets. The proposal was sent through Pakistani mediators. Tehran confirmed it was reviewing the terms.
This is the most detailed peace framework since the US-Iran war began in February 2026. Markets priced it accordingly, and then something more interesting happened.
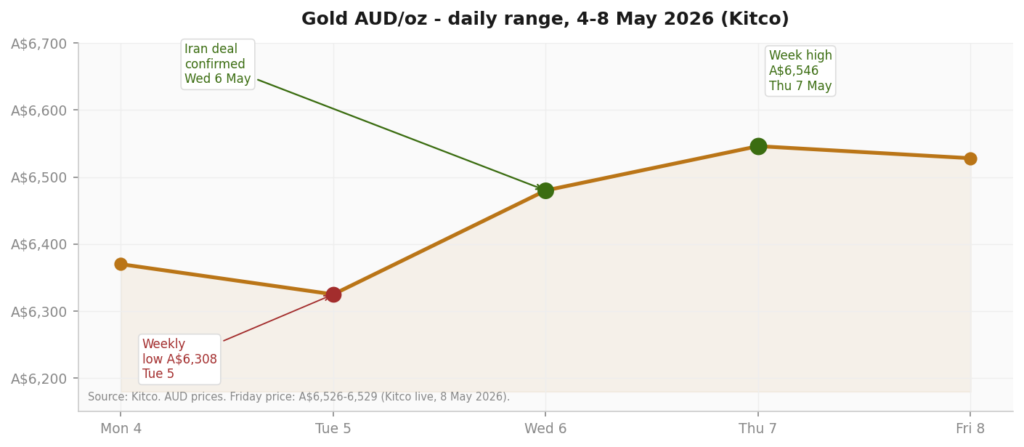
Chart 1: Gold AUD/oz daily range, 4-8 May 2026.
The Thursday Hold — What It Actually Means
On Thursday, US military officials briefed the President on potential strike options against Iran. That is a genuine escalation headline, the kind that, three months ago, would have sent gold sharply lower as traders priced in a stronger dollar and higher oil.
Gold did not sell off. It held above A$6,520.
To put that in plain terms: gold moved from around A$6,370 at the start of the week to a high of A$6,546 on Thursday, a recovery of roughly A$176 per ounce across four sessions. When the military briefing arrived, the recovery held. The buyers did not leave.
This tells us something important about the current market structure. The holders who kept gold steady through that headline were not ignoring the risk of military action. They were demonstrating that their reasons for holding gold extend beyond any single geopolitical development in either direction. The market has moved past reactive headline trading into a different kind of positioning, one based on the longer-term backdrop rather than individual news events.
Gold Has Stopped Reacting to Headlines. It Is Responding to Regimes.
Three months ago, every geopolitical development out of the Middle East moved gold in a predictable direction. A ceasefire extension pushed it lower. A ship seizure pushed it higher. That mechanical relationship has changed significantly, and this week is the clearest illustration of it.
Gold did not surge and then pull back on the Iran deal news. It moved up steadily and held there even when the counter-headline arrived. This is the behaviour of a market that has re-priced gold from a short-term hedge into a longer-term structural position.
The buyers are no longer responding to individual news events. They appear to be positioned based on a broader view about monetary credibility, reserve asset alternatives, and the structural role of physical assets in a world where geopolitical and political risk has become persistently elevated.
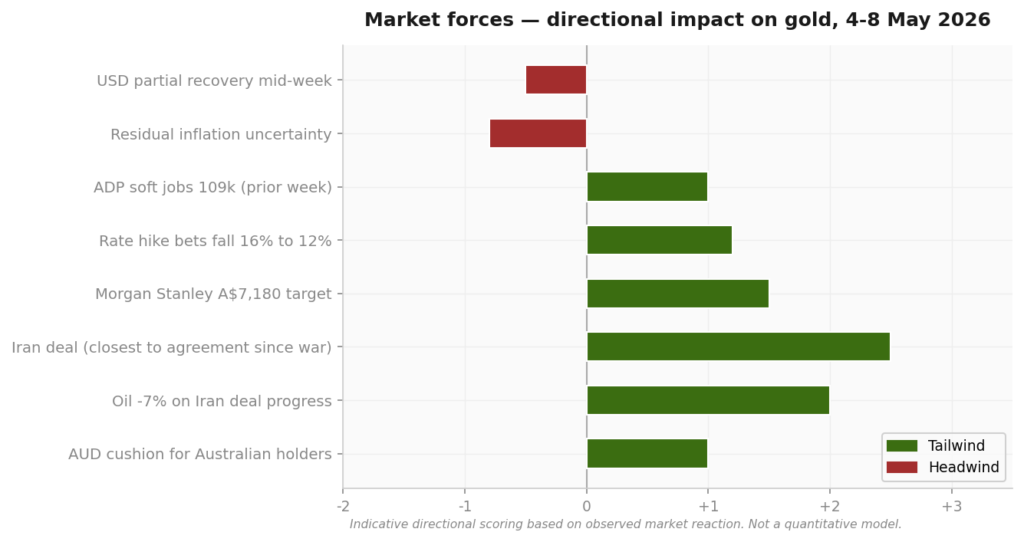
Chart 2: Directional impact of key macro forces on gold, week of 4-8 May 2026. The Iran deal progress and oil sell-off were the dominant tailwinds. Residual inflation uncertainty and a modest mid-week dollar recovery were the only meaningful headwinds.
The safe-haven bid for gold has matured. The floor under gold is being set not by weekly headlines but by a broader reassessment of what reliable stores of value look like in the current global environment.
What does this mean practically? It means gold is now responding more to macro data – jobs numbers, inflation prints, rate expectations, than to geopolitical events. The week’s ADP print of 109,000 jobs, well below expectations, fed into this week’s positioning and added to gold’s upward momentum.
When employment growth slows, central banks historically face less pressure to maintain elevated rates. Lower rates reduce the cost of holding non-yielding assets like gold relative to cash and bonds. This is one of the mechanisms the market watches closely, and it was a meaningful part of this week’s story alongside the geopolitical developments.
Silver Moved Three Times as Hard as Gold. Here Is the Explanation.
Gold had a strong week. Silver had a stronger one.
From Monday to Friday, gold added approximately 2.5%. Silver added nearly 7.8%. The gap is significant, and understanding why it happened explains a lot about how these two metals are positioned right now.
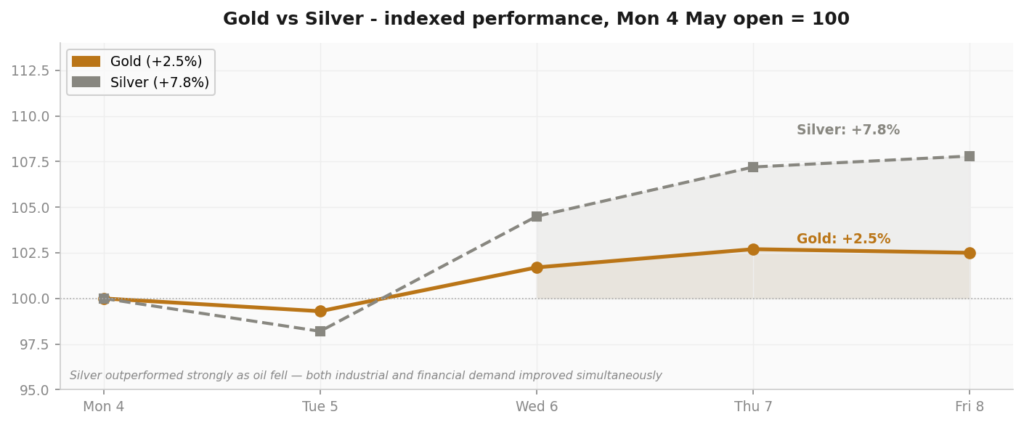
Chart 3: Gold vs Silver indexed performance
Silver’s Double Tailwind
Silver functions in two markets at once. It is a financial asset that responds to the same safe-haven and rate-expectation forces as gold. And it is an industrial metal used in solar panels, electronics, electric vehicles, and AI infrastructure.
When oil fell nearly 7% on news of progress on the Iran deal, two things happened to silver at the same time. The easing of inflation fears improved the case for rate cuts, which supported silver’s financial demand. And the improvement in the global economic outlook that comes with lower energy costs supported silver’s industrial demand case. Both tailwinds hit silver simultaneously this week.
Gold only had one of those tailwinds working for it. That is why silver’s percentage move was roughly three times that of gold.
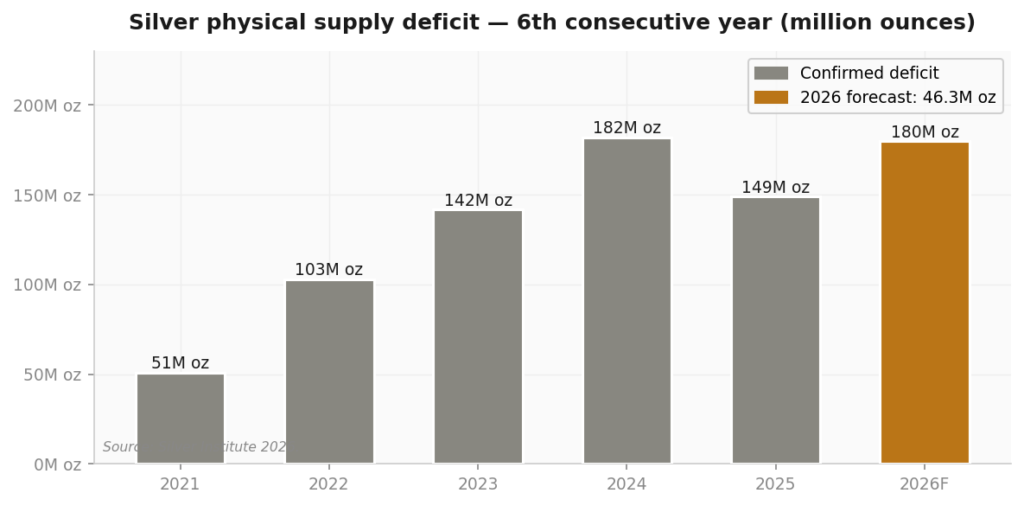
Chart 4: Silver physical supply deficit 2021-2026 forecast (million ounces).
Silver at A$111-112 this week is recovering toward where its structural supply-demand fundamentals point. The sixth year of supply deficit is not a short-term phenomenon. It is a structural condition that has been building since 2021.
Data points indicate 2026 as a sixth consecutive year of global physical silver supply deficit, with a projected shortfall of 46.3 million ounces. Chinese silver imports in the first quarter of 2026 continued to run above historical seasonal averages. Solar manufacturing demand grows structurally every year. Understanding these dynamics helps explain why silver can move sharply when macro conditions improve, even from a relatively depressed base.
Morgan Stanley Said A$7,180. Rate Hike Bets Fell. The Dollar Softened.
Three macro developments shaped the precious metals backdrop this week beyond the Iran story.
First, Morgan Stanley published a 12-month gold price target of USD $5,200 per ounce, roughly A$7,180 per ounce, around 10% above where gold is trading this week. The target was built on three structural factors:
- Sustained central bank buying
- Continued pressure on the US dollar’s credibility, and
- Elevated geopolitical uncertainty that is not resolved simply by a ceasefire framework.
Second, rate hike bets for December fell from 16% to 12% across the week. Treasury yields eased. The US Federal Reserve’s path is not straightforward, Chicago Fed President Austan Goolsbee noted this week, as inflation has not continued cooling toward the 2% target and has actually accelerated since the war began. But the overall direction of rate expectations moved in a way that reduced the relative cost of holding gold versus interest-bearing assets.
Third, the US dollar softened meaningfully. For Australian holders of physical gold, this created a favourable setup. The AUD sat near 72 cents against the USD, providing a natural currency buffer. When the dollar falls and gold rises in USD terms, the A$ gold price tends to move more strongly than the global headline suggests.
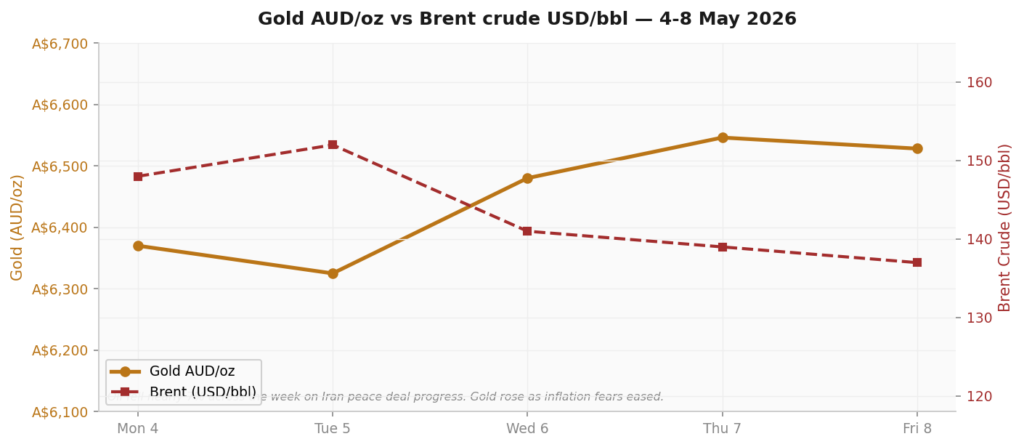
Chart 5: Gold AUD/oz vs Brent crude USD/bbl, 4-8 May 2026.
The Other Precious Metals Had a Quiet But Positive Week
Gold and silver dominated the precious metals story this week, but platinum and palladium both moved in a broadly positive direction as the macro backdrop improved.
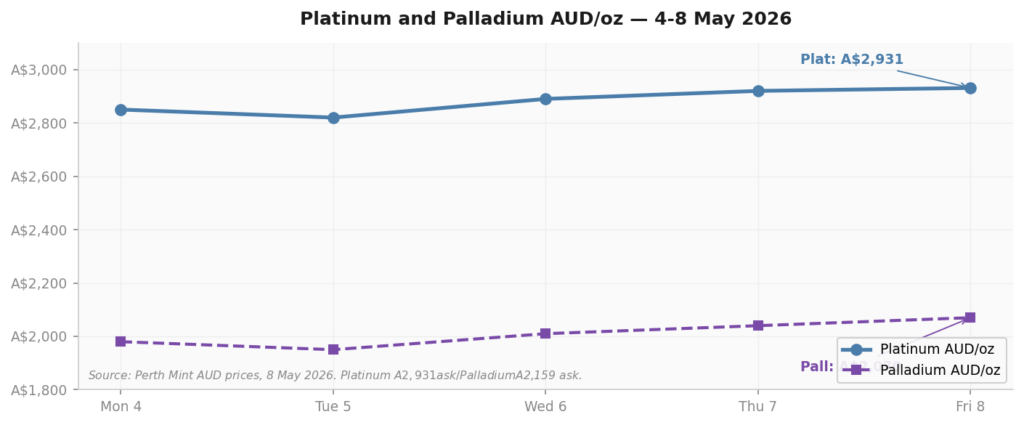
Chart 6: Platinum and Palladium AUD/oz, 4-8 May 2026.
Platinum
Platinum ended the week around A$2,931 per ounce ask, up modestly from its Monday open. Platinum’s price behaviour is closely tied to industrial demand, particularly from the automotive sector, where it is used in catalytic converters, and from the growing hydrogen economy, where platinum plays a role in fuel cell technology.
The easing of oil-driven inflation fears this week was a positive signal for global industrial activity, which supported platinum alongside silver. Platinum continues to trade at a significant discount to gold, a relationship that has historically been unusual, as platinum traded above gold for much of the pre-2015 era. Understanding what drives platinum’s discount to gold is one of the more interesting structural stories in the precious metals space.
Palladium
Palladium ended the week around A$2,159 per ounce ask, also firmer on the week. Palladium is predominantly used in petrol engine catalytic converters and is heavily dependent on automotive production volumes and the pace of the transition to electric vehicles.
Unlike platinum, palladium has limited use in hydrogen technology, which means its long-term demand outlook is more directly tied to the internal combustion engine sector. The Iran de-escalation and potential oil price stabilisation are a mild positive for palladium insofar as it supports global manufacturing and automotive production forecasts. However, palladium remains a more niche consideration within a precious metals portfolio compared to gold and silver.
China Bought Gold for the 18th Month. The Institutional Direction Is Clear.
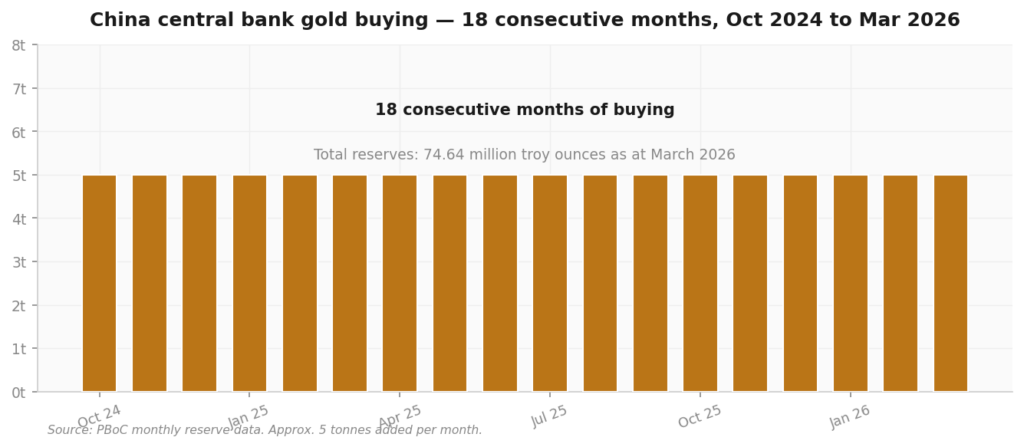
Chart 7: China Central Bank gold buying, October 2024 to March 2026
China’s central bank added to its gold reserves again in March 2026, its 18th consecutive month of buying. Total reserves now sit at 74.64 million troy ounces. At roughly 5 tonnes added per month across that period, the accumulated position is significant.
This is a useful data point for understanding the broader market structure. When the world’s second-largest economy systematically shifts its reserve composition toward gold over 18 consecutive months, it is making a policy statement about how it views the global monetary order. China is not the only one; Poland, Kazakhstan, and India’s central banks have all been active buyers in 2026. The World Gold Council forecasts official sector purchases this year at 850 to 950 tonnes, near record levels.
These buyers are not responsive to short-term price movements. They accumulate steadily regardless of weekly news flow. Understanding this structural demand layer helps explain why gold tends to find a floor even during periods of short-term selling pressure.
Central bank buying at near-record levels represents one of the most significant structural demand dynamics in the gold market. These are generational allocation decisions, not short-term trades.
Five things worth understanding heading into the week ahead:
1. The Iran deal is the key variable to watch. If Tehran formally accepts the framework, oil could fall further, and inflation expectations could ease meaningfully. If talks break down, oil spikes, and the energy-inflation dynamic that has weighed on gold returns. Either scenario has meaningful implications for the precious metals backdrop.
2. Friday’s Nonfarm Payrolls is an important data point to understand. After ADP printed 109,000 jobs, a soft payroll number would confirm a genuine labour market slowdown. When employment growth slows, central banks historically face less pressure to maintain elevated rates, which reduces the relative cost of holding non-yielding assets like gold. This is one of the key mechanisms the market watches in the current environment.
3. Silver’s outperformance reflects its dual role. A 7.8% weekly move against gold’s 2.5% reflects silver’s sensitivity to both financial and industrial demand conditions. Understanding this dual role helps explain why silver can move significantly harder than gold when macro conditions improve across both dimensions simultaneously.
4. A$7,180 target is a data point, not a guarantee. When major institutions publish price targets, they reflect that institution’s analysis of structural forces. The target was built on central bank buying, dollar weakness, and geopolitical uncertainty. Understanding the reasoning behind such targets, rather than treating them as predictions, is a useful exercise for anyone following the gold market.
5. The AUD dynamic is worth understanding for Australian holders. With the AUD at approximately 72 cents against the USD, movements in the exchange rate affect the A$ price of gold independently of the global USD price. When the USD falls, Australian holders may see the A$ gold price move more than the international USD-denominated price suggests. This is a structural feature of holding gold in Australian dollars.
The Fog of War Is Lifting. The Questions Are Getting More Structural.
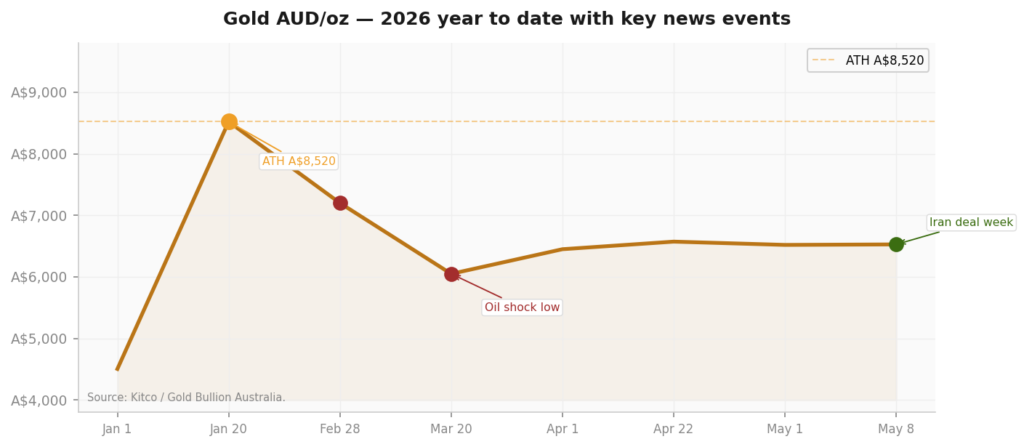
Chart 8: Gold AUD/oz year to date 2026. Source: Kitco / Gold Bullion Australia. The year moves from the January ATH above A$8,520, through the oil shock low near A$6,050 in March, to this week’s recovery. Friday’s Kitco price A$6,526-6,529 represents the latest data point in the recovery from the March low.
The Iran peace deal, if it holds, changes one measurable thing for gold: it removes the energy-price inflation premium that has been pushing rate expectations higher and weighing on gold since February. Lower oil means lower inflation, which changes the Fed’s calculus on rates, which changes the relative attractiveness of gold versus interest-bearing assets. That is a real and meaningful shift if it plays out.
But the structural forces that drove gold from A$4,506 at the start of 2026 to an all-time high above A$8,520 in January were broader than the Iran war. They included central bank reserve diversification, questions about the US dollar’s long-term reserve currency role, and a global environment in which physical assets without counterparty risk have become more valued. None of those forces has resolved this week.
The Bank of France’s decision to repatriate its gold from US vaults earlier this year, completing a transfer back into European custody, is one of the more symbolic data points of 2026. When major central banks move physical gold out of American custody, it signals something about how those institutions view the global monetary environment.
The Iran deal may reduce the geopolitical risk premium in oil. But the structural case for gold was never only about the war. It is about a world that has changed its relationship with hard assets.
What would be worth watching in the weeks ahead from an educational standpoint? The Iran peace talks, whether a formal agreement is reached, and whether oil prices stabilise at lower levels. Friday’s Nonfarm Payrolls number and what it reveals about US labour market conditions. Any further signals from the Federal Reserve about the rate outlook. And continued data on central bank gold purchasing, which represents one of the most consistent structural demand signals in the market.
For silver, the supply deficit story, the solar and AI demand growth, and the pace of Chinese import volumes are the structural data points worth following. Weekly price movements reflect short-term positioning. The longer-term picture is being shaped by forces that play out over quarters and years, not sessions.
For platinum and palladium, the automotive production outlook, the pace of EV adoption, and the development of hydrogen fuel cell technology are the key variables that determine long-term demand. Both metals remain relatively niche within the precious metals space, but both benefit from the same broader improvement in global industrial conditions that supported them this week.