
 0
0From Spike to Reset: Gold, Silver and the March Metals Wash‑Out

Where prices are now
Let’s start with where things actually sit right now for an investor.
- Gold is trading in the mid‑A$6,500s per ounce, after spending early March up above A$7,400.
- Silver is hovering around A$100 per ounce, having dropped from the A$120–126 area earlier in the month and then bouncing off the high‑A$90s.
- Platinum is sitting in the high‑A$2,600s to high‑A$2,800s per ounce, with recent highs just over A$2,800 and lows in the A$2,630s.
- Palladium is trading near A$2,000–2,100 per ounce, with recent daily highs a bit above A$2,090 and lows closer to A$1,950.
All four have come off the boil from the peaks we saw earlier in the year, but none of them are “cheap” versus where they were 6–12 months ago.
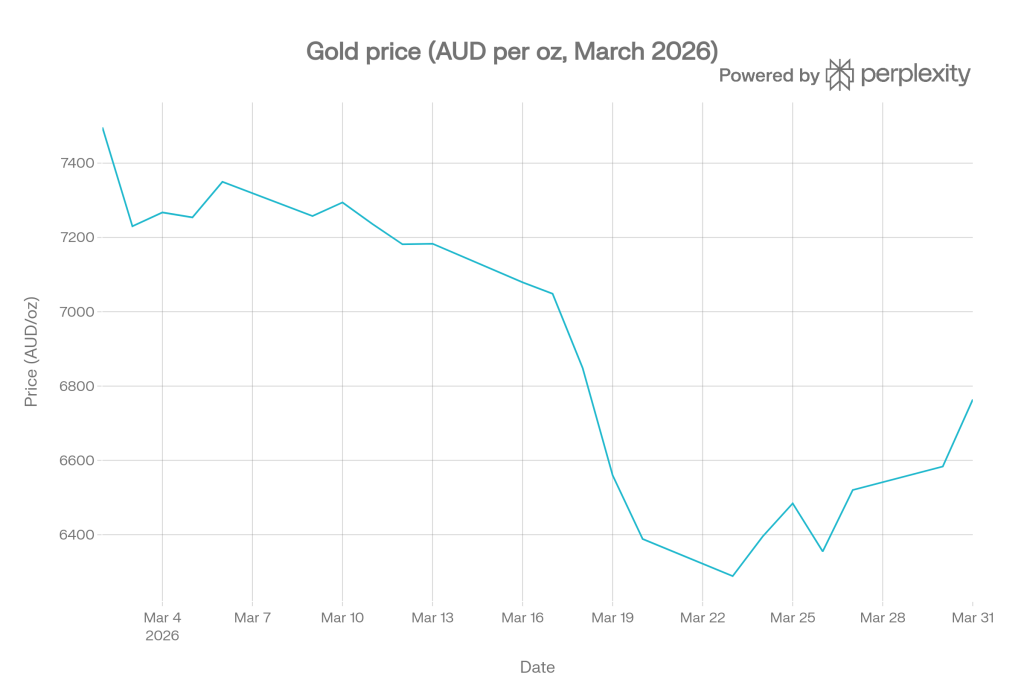
Line chart of gold for March 2026 highlighting the early‑month spike and the reset into the mid‑A$6,000s.
What caused the pullback
The sell‑off hasn’t been random. Three big forces hit at once.
Higher yields and delayed rate cuts
- Markets pushed rate‑cut hopes further out as inflation stayed sticky.
- That made bond yields and cash look a bit more attractive, which tends to hurt non‑yielding assets like metals in the short term.
Oil and war headlines
- Conflict in the Middle East and worries about supply routes helped push energy prices higher again.
- US and Israeli strikes on Iranian targets, Iranian missile and drone retaliation, and concerns around traffic through the Strait of Hormuz all raised the risk that an already‑fragile region could stay unstable for longer.
- That rattled broader markets and drove a “sell first, ask questions later” mood across risk assets.
Forced selling and de‑leveraging
- After a huge run-up – gold and silver both set fresh record highs in early March – a lot of leveraged and short‑term money was sitting in the trade.
- Once prices cracked, margin calls and risk limits forced funds to dump positions quickly, turning a normal pullback into a proper wash‑out.
That combo gave us a three‑week losing streak in gold and an even heavier fall in silver, but it also burned off a lot of the “hot money” and froth that had built up.
Geopolitics: why the world keeps reaching for gold
March’s price action makes more sense when you layer in the geopolitics.
- The Iran–Israel confrontation and regional proxy clashes pushed safe‑haven demand sharply higher, with traders openly talking about a “war premium” in gold.
- Missile and drone strikes in and around Iran, Lebanon and Syria, plus repeated threats to key shipping lanes, kept investors on edge about a bigger regional conflict and potential disruption to oil flows.
- At the same time, central banks, especially in emerging markets and the BRICS bloc – have continued to add to their gold reserves over recent years as a hedge against sanctions risk, debt concerns and currency debasement.
Each major geopolitical flare‑up since the Russia–Ukraine escalation has tended to ratchet the floor for gold higher, even when the immediate panic passes. That background bid helps explain why this correction looks like a reset from extreme levels rather than a collapse of the safe‑haven story.
Gold – from blow‑off to base‑building
Gold’s March journey looks like a classic spike, flush, reset.
- Early March: traded around A$7,250–7,500 per ounce, marking fresh highs.
- Mid‑month: slid into the low‑A$6,000s, with daily closes clustering around A$6,300–6,450.
- Late March: now holding in the mid‑A$6,500s, with intraday swings but no fresh breakdown.
In other words, the air has come out of the top, but the structure underneath is still there. On longer‑term charts, gold remains in a clear uptrend, with this month’s pullback looking more like a reset to the trend line than a full‑blown reversal.
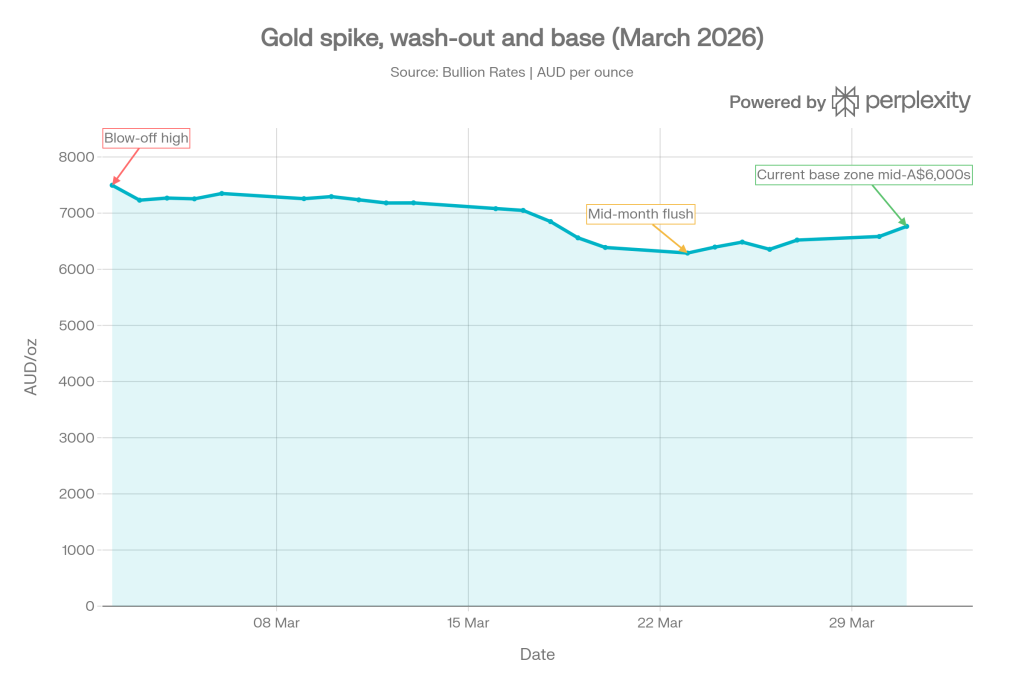
Gold with three annotations: “Blow‑off high”, “Mid‑month flush”, “Current base zone around mid‑A$6,000s”.
For investors, the takeaway is simple:
- Gold is no longer priced for outright panic.
- But it’s still expensive enough to show that the market hasn’t abandoned the hedge against inflation, war risk and currency risk – especially with conflicts and great‑power tensions still simmering in the background.
Silver – the higher‑octane sidekick
Silver has played its usual role as gold’s more volatile cousin.
From the March history:
- Early March: around A$120–126 per ounce.
- 20 March low: intraday levels in the mid‑A$90s.
- Late March: recovering into the A$100–104 area.
Silver has dropped sharply over the month, but it is still trading well above where it was a year ago – another sign that the move is giving back excess rather than destroying the underlying trend.
Silver also leans more on industrial demand – solar, electronics, EVs – whereas gold is anchored by investment and central‑bank buying. That means:
- It benefits when geopolitics and energy shocks drive investment into the metals complex.
- But it also has to price in the risk that global manufacturing and trade slow if conflicts or higher oil prices drag on growth.
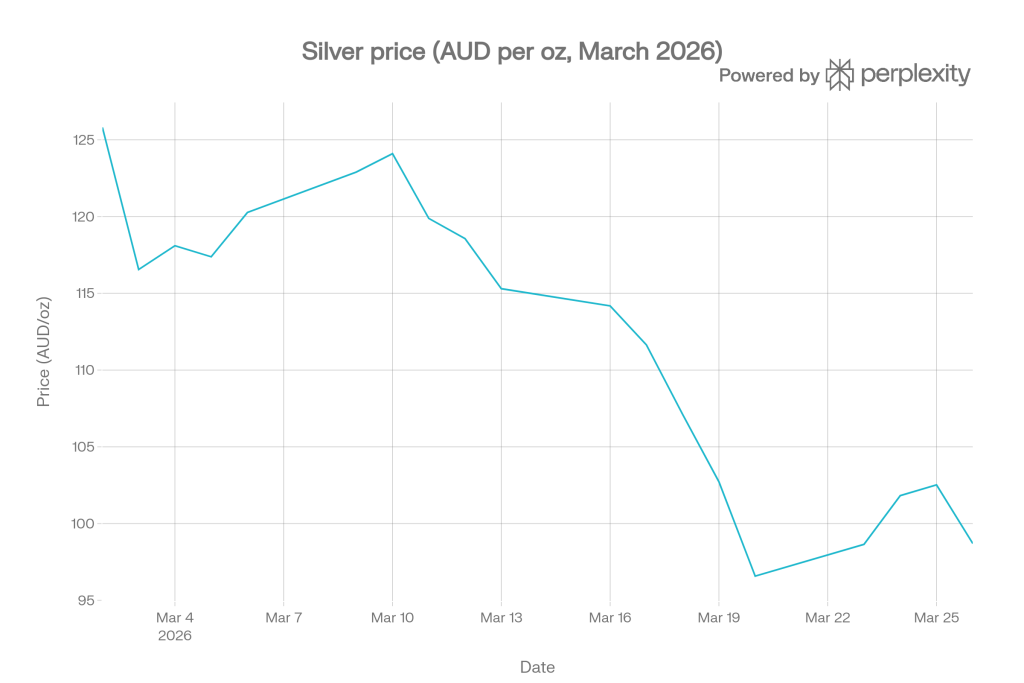
Silver in AUD for March 2026 showing the steep roll‑over from the A$120s to under A$100, then the small bounce back above A$100.
For a local investor, that frames silver as a satellite holding rather than the core: higher risk, higher reward, and best handled with a longer time horizon and good nerves.
What the miners and ETFs are telling us
Price is one thing. The listed vehicles around gold and silver tell you how sentiment has shifted.
- The gold‑miners ETF has dropped from roughly US$101 down into the low‑US$90s, landing right on a support shelf that has held several times since late 2025.
- Momentum indicators show RSI dipping into the mid‑30s and price briefly punching below the lower Bollinger Band before snapping back inside – a classic “oversold” signal rather than the start of a new up‑leg for volatility.
The silver ETF has seen even more extreme action:
- Two closes below the lower Bollinger Band.
- RSI touching the bottom of an upward‑sloping channel.
- Three prior cases where that same pattern marked the end of a sell‑off and the beginning of a sharp rally.
Put in plain English:
- A lot of fast money has bailed out of the miners and silver trade.
- The charts now look washed‑out, not euphoric.
That doesn’t mean prices will rocket back straight away, but it does suggest we’re closer to the end of this correction than the beginning, as long as the macro backdrop – rates, war headlines, oil prices – doesn’t take another turn for the worse.
Platinum and Palladium – quick health check
Platinum and palladium have been dragged into the same risk‑off move, but the underlying stories are a bit different.
Platinum
Platinum has traded between roughly A$2,635 and A$2,810 per ounce in the last week of March, with the live spot now near the high‑A$2,000s.
Looking across March, it has stepped down from levels above A$3,000 but remains well above where it was in mid‑2025, reflecting ongoing tightness in supply versus demand from industry and autocatalysts.
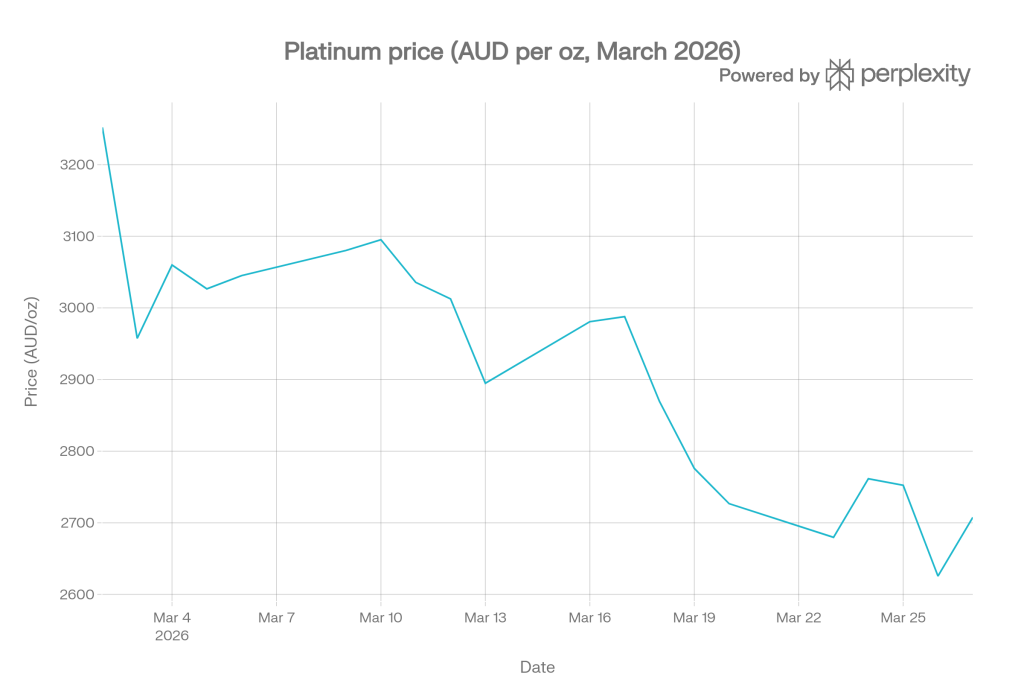
Platinum in AUD for March 2026, highlighting the move from above A$3,000 back into the high‑A$2,000s.
Palladium
Palladium’s price is fluctuating around A$2,000–2,100 per ounce, with recent intraday highs near A$2,092 and lows around A$1,950.
Over the past year it is still sitting well above last year’s lows, even after a double‑digit percentage pullback during March, which fits the pattern of a market cooling off after a big run rather than collapsing outright.
Palladium’s demand is still heavily tied to petrol‑vehicle exhaust systems, with the longer‑term shift to EVs hanging over it, so its chart looks more like a wide trading range than a clean uptrend. That makes it more of a tactical trade than a core allocation for most portfolios.
Big picture for investors
Pulling it all together:
- Gold has dropped from euphoric highs back into a more sustainable band, but it’s still elevated and holding a clear uptrend.
- Silver has done what silver does – over‑reacted both ways – and is now sitting near A$100/oz after a sharp monthly slide from its peak.
- Miners and silver ETFs look more exhausted than manic, with several classic technical signs that the bulk of the forced selling may have already played out.
- Platinum and palladium have been repriced lower, but remain far above last year’s levels, consistent with still‑tight supply and the lingering impact of their huge earlier rally.
The macro reasons people hold metals – inflation worries, war risk, and currency uncertainty – haven’t disappeared. What March has really delivered is a reset in entry levels, not the end of the story, in a world where geopolitics and policy can still flip risk‑sentiment on its head with a single headline.