
 0
0Gold vs Oil: The Tug of War That Is Defining the Precious Metals Market
Trump spoke about Iran on Monday, and oil surged near USD $108. By Wednesday, early Middle East supply signs had cooled inflation fears and gold steadied. By Friday, both metals were sitting close to where they started the week. On the surface, not much happened. Underneath, the tug of war that has been defining gold’s behaviour since February 2026 played out again — in compressed form — across just five sessions. Here is what it means.
THE WEEK’S TURNING POINT
The Same Tug of War. The Same Result. Gold Held.
Monday started with Trump. His comments about Iran and the Strait of Hormuz sent oil surging toward USD $108 per barrel. Gold fell from around A$6,355 to A$6,330 across Monday and Tuesday as inflation fears flared and traders priced in a more hawkish Fed outlook.
Then Wednesday happened. Early signals of Middle East supply easing gave markets brief relief. Oil pulled back from its highs. Gold steadied and recovered toward A$6,355, then held that level through Thursday.
By Friday’s close, gold was at A$6,337.78 – A$6,340.59 – down just 0.24% on the day and within A$20 of where it opened the week. It looks quiet. It was not quiet.
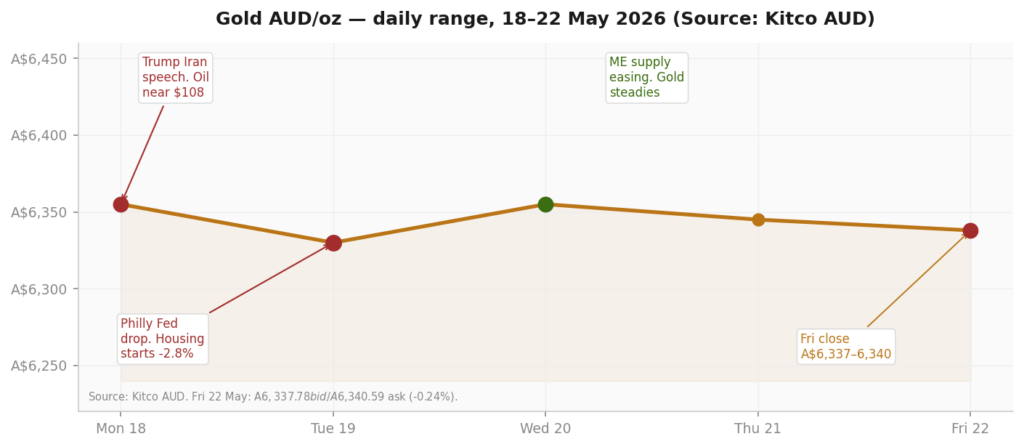
Chart 1: Gold AUD/oz daily range, 18-22 May 2026.
The market that held A$6,330 on Tuesday, after oil surged near $108 on Monday, is telling you something. It is not panicking. It is waiting. The floor beneath gold is deeper than the weekly noise suggests.
What is interesting about this week is not the range – it is the resilience. Three separate negative signals arrived: Trump’s Iran comments, the oil surge, and continued rate-hike pricing. Gold absorbed all three and closed within A$20 of its weekly open. That is the behaviour of a market with genuine structural support underneath it.
SAFE-HAVEN DEMAND
Oil Is Gold’s Short-Term Enemy and Long-Term Friend. This Week Showed Both.
The relationship between oil and gold is one of the more misunderstood dynamics in the precious metals market. The instinctive assumption is that rising oil should support gold, both are hard assets, both benefit from geopolitical uncertainty. In the short term, the opposite is often true.
When oil rises sharply, inflation expectations jump. When inflation jumps, markets price in higher interest rates. When rate expectations rise, the US dollar strengthens. When the dollar strengthens, gold, priced in dollars, falls. That is the chain that played out Monday and Tuesday when Trump’s Iran comments sent oil to the USD $105–108 range and gold fell roughly A$25.
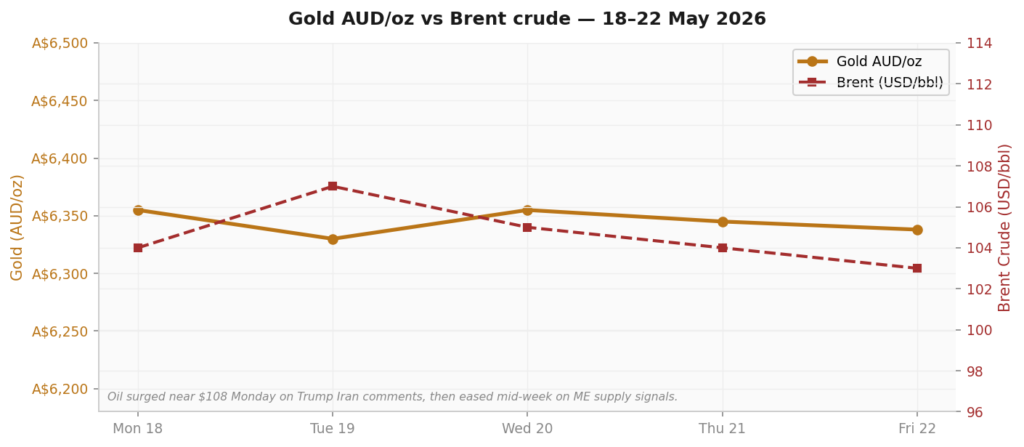
Chart 2: Gold AUD/oz vs Brent crude USD/bbl, 18-22 May 2026. The inverse oil-gold relationship is clear across the week.
The longer-term version of the same dynamic: when oil eventually falls, through a confirmed Iran deal, or demand destruction from a slowing economy – inflation expectations ease, rate hike pressure reduces, the dollar softens, and gold gets a direct tailwind. The same oil price that is a short-term headwind becomes a long-term tailwind when it resolves.
Oil is the dial that controls the inflation-rates-dollar chain that determines gold’s short-term direction. Right now oil is at a resistance zone. Which way it breaks from here is the most important question in the precious metals market.
The energy sector ETF (XLE) confirms the picture. After rallying to $59.50 last week — just short of the $60 target — XLE is back at the top end of its uptrend channel with the daily RSI at resistance around 60. Oil in the $105–110 range is historically where Iran peace deal headlines tend to re-emerge. Gold’s mid-week recovery when supply easing signals arrived reflects exactly that expectation being priced in.
THE ECONOMIC DATA STORY
Weak US Data Is Quietly Building Gold’s Case. Nobody Is Talking About It.
While Trump’s Iran comments grabbed the headlines, a quieter story was developing in the US economic data. It deserves more attention than it received.
The Philadelphia Federal Reserve’s manufacturing survey dropped sharply in May, falling into negative territory for the first time since early 2026. US housing starts fell 2.8% in April. Building permits rose 5.8%, offering a partial offset, but the construction sector picture is one of softening momentum rather than expansion.
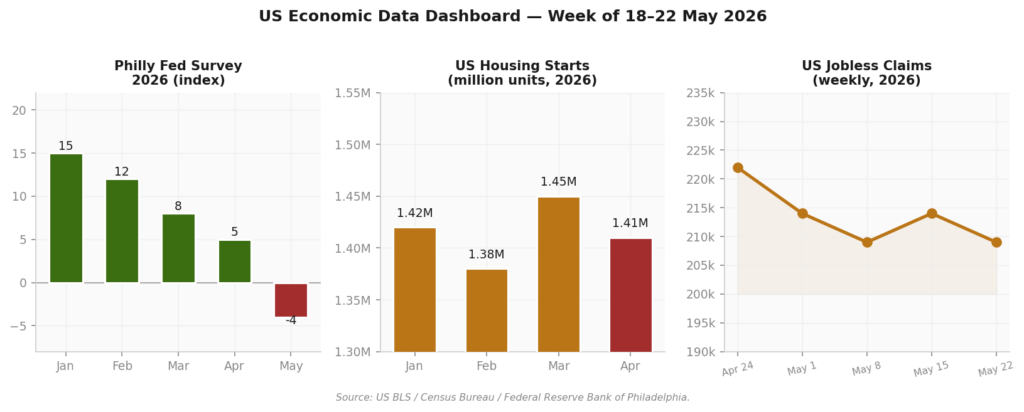
Chart 3: US economic data dashboard, week of 18-22 May 2026. The Philly Fed survey turned negative in May for the first time this year. Housing starts fell 2.8% in April. Jobless claims held at 209,000 — still relatively firm but part of a softening trend since February.
Weekly jobless claims came in at 209,000 — still historically firm, but part of a trend that has seen claims ease from higher levels earlier in the year. The labour market remains the Fed’s primary justification for keeping rates elevated. When it softens, the entire rate narrative shifts.
The oil-inflation-rates chain that has been gold’s primary headwind since February depends on the Fed having both the justification and the political will to keep rates elevated. If the US economy softens meaningfully — manufacturing contracting, housing slowing, jobs data weakening — the Fed loses that justification. Rate hike bets fall. The dollar softens. Gold gets room to move. This week’s data is pointing in that direction, quietly.
GOLD VS SILVER
Silver at A$106. The Structural Story Has Not Moved.
Silver ended the week at A$106.48 — down 0.56% on the day. That modest softening follows last week’s dramatic round trip: up 6% the Monday before, down 8% the following Friday.
Silver runs on two separate demand engines simultaneously. The financial engine responds to rates, dollar movements, and safe-haven positioning, the same forces as gold. The industrial engine responds to global economic activity, manufacturing output, and the growth of solar, EV, and AI infrastructure.
When both engines point the same direction, silver moves dramatically. When they point in opposite directions, silver whips between the two. This week’s modest softening reflects a market in equilibrium between its two drivers, neither strongly positive nor strongly negative.
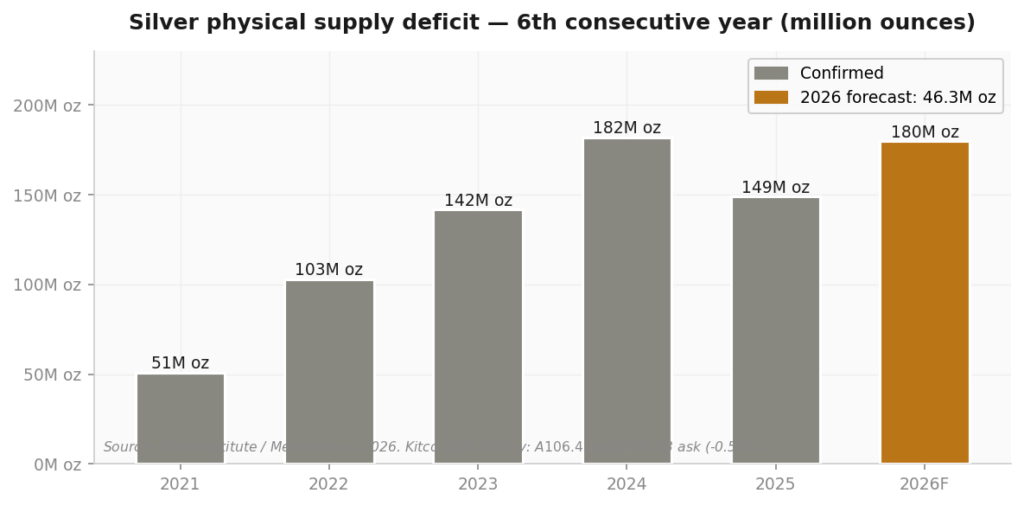
Chart 4: Silver physical supply deficit 2021-2026 forecast (million ounces).
The structural picture underneath the volatility has not changed. Six consecutive years of global silver supply deficit. COMEX registered inventory coverage below the 15% stress threshold for seven months running. Solar manufacturing demand growing structurally year on year.
Silver’s weekly volatility is paper market noise. The structural supply deficit is a multi-year signal. These two things exist simultaneously — and understanding the difference is what separates long-term holders from short-term traders.
It is also worth noting that platinum and palladium were softer this week. Platinum at A$2,706.87 – A$2,720, down 1.72%, and palladium at A$1,885.83 – A$1,941.96 range, down 1.95%. Both metals are more sensitive to automotive and industrial demand conditions than to the gold-oil-rates dynamic. The softness this week reflects modest industrial demand uncertainty rather than any structural change.
THE INSTITUTIONAL PICTURE
Lombard Odier Said USD $5,400. Here Is the Story Behind the Number.
The most significant analysis published this week came from Lombard Odier, which published a gold price target of USD $5,400 per ounce by H1 2027. In Australian dollars at the current exchange rate of 0.7120, that converts to approximately A$7,584 — roughly 19% above where gold is trading at A$6,338 today.
The target is not a speculative call. It is a structured argument about what happens to gold once the Iran war ends and the current oil-inflation-rates headwind resolves. The thesis: gold’s structural bull market driven by central bank reserve diversification, dollar credibility erosion, and a repricing of hard assets, was interrupted by the Iran war’s inflationary consequences. When that interruption ends, the original trajectory resumes.
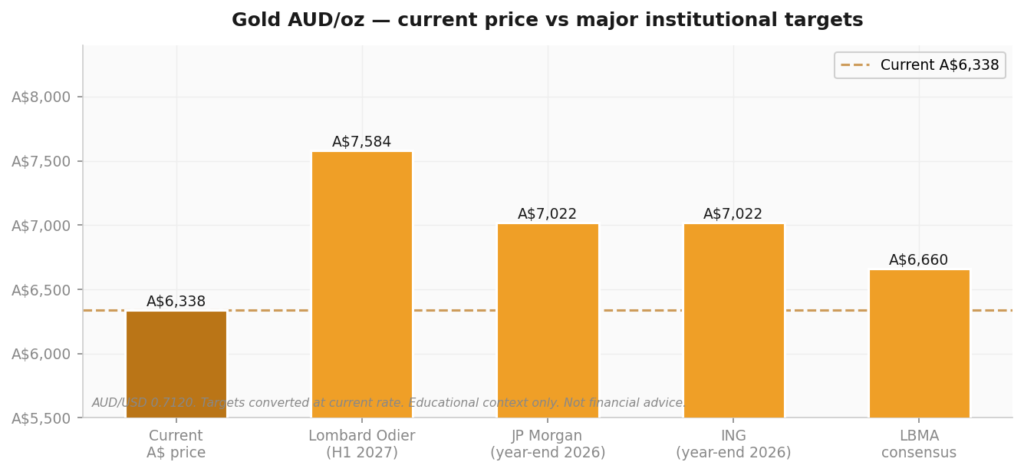
Chart 5: Gold AUD/oz current price vs major institutional targets.
From a one-week perspective, gold is flat and under pressure. From a one-year perspective, gold is 40% above where it started 2026, has survived a significant correction from its all-time high, and has institutional targets sitting 5 to 19% above current levels from multiple separate analytical houses.
The US national debt hitting USD $40 trillion is the structural backdrop behind all of those targets. When a government carries a debt load of that magnitude, the long-term credibility of its currency comes under pressure. Central banks understand this, it is why they have been systematically buying gold for 18 consecutive months, not because gold had a good week, but because they have made a structural assessment about the world’s monetary architecture.
WHAT PHYSICAL HOLDERS NEED TO KNOW
Five Things That Actually Matter This Week
- Gold holding A$6,330 through oil at $108 is the signal, not the price itself. The conditions gold held through this week were genuinely challenging. It absorbed them and closed within A$20 of its weekly open. That is structural support, not luck.
- Oil at the $105-110 resistance zone is the primary variable to watch. The XLE energy ETF is at the top of its uptrend channel with RSI at resistance. Historical pattern: this is where Iran peace headlines re-emerge. If oil breaks lower from here, the inflation-rates-dollar headwind begins to unwind.
- The Philly Fed turning negative is worth watching closely. One month does not make a trend. But the direction matters. If US manufacturing data continues to soften, the Fed loses its primary justification for keeping rates elevated. That changes gold’s near-term backdrop substantially.
- The A$7,584 Lombard Odier target provides structural context, not a trading signal. Understanding the argument behind it, that gold’s structural bull market was interrupted, not ended, by the Iran war, helps frame the current A$6,338 price within a longer story.
- For Australian holders, the AUD cushion continues to operate quietly. With AUD/USD at 0.7120, the A$ gold price is naturally buffered against USD-driven moves. When the dollar rises on rate expectations, the AUD softens too, meaning A$ gold declines less than the international headline suggests.
WHERE TO FROM HERE
The Story Is Simple. Oil Is the Variable. Everything Else Follows.
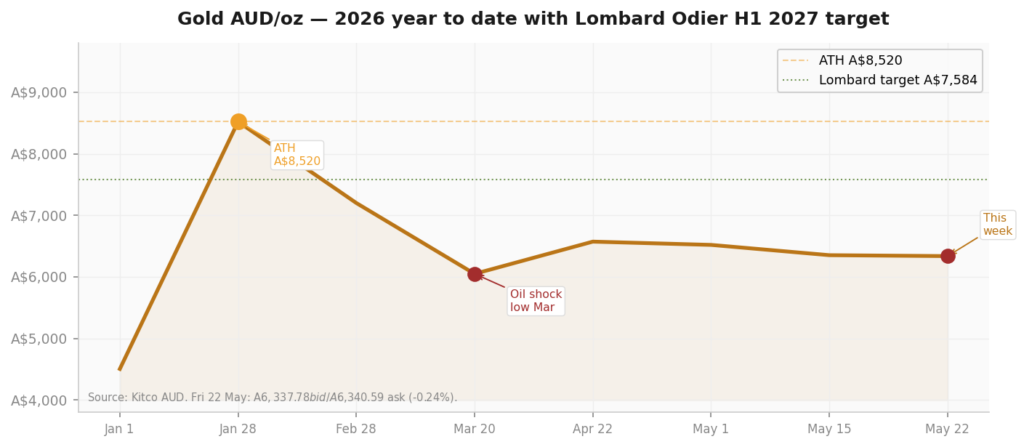
Chart 6: Gold AUD/oz year to date 2026 with Lombard Odier H1 2027 target overlaid.
The precious metals narrative for the week of 18 to 22 May 2026 is cleaner than it looks in the daily price moves. Gold is caught between two forces.
The first is oil. As long as oil stays in the USD $105–110 range, energy-driven inflation stays elevated, the Fed stays hawkish, the dollar stays supported, and gold faces a structural short-term headwind. This week’s recovery from A$6,330 to A$6,355 happened because supply easing signals suggested oil might pull back. Gold is watching oil more closely than any other variable right now.
The second is the US economy. As long as economic data continues to soften, Philly Fed turning negative, housing starts declining, jobless claims trending gently higher, the case for the Fed to keep rates elevated weakens. A sufficiently soft set of data over the coming weeks could shift the rate narrative meaningfully.
Both dynamics point toward the same resolution. An Iran peace deal brings oil lower, eases inflation, and removes the primary headwind for gold simultaneously. A softening US economy reduces the Fed’s justification for hiking. When those two forces align, the path toward Lombard Odier’s A$7,584 target becomes much more legible.
The current gold price is not where it is because the structural bull market has ended. It is where it is because an energy war created an inflationary headwind that temporarily interrupted that market. When the interruption ends, the underlying direction reasserts itself. That is the story this week confirmed — quietly, across five sessions, with gold at A$6,338 holding its ground.
What to watch in the week ahead: any Iran developments that move oil. The direction of oil out of the $105-110 resistance zone. US PMI or consumer data that adds to the softening picture. And the broader tone from the Warsh Fed on the rate direction going into summer.