

 0
0Silver’s 45-Year Breakout: Why A$100 Silver Isn’t Hype, It’s Maths

Here’s The Thing
Silver just hit an all-time high of A$88.87 on December 2. The pattern that got us here? 45 years in the making. Now it’s broken. The technicals are clean. The macro’s aligned. And unless something goes seriously sideways, A$100+ silver is what comes next.
Let’s cut through the noise and look at what the charts are actually telling us.
The 45-Year Cup-and-Handle: Pattern Breaking After Four Decades
Silver’s been consolidating since 1980. That consolidation became a cup-and-handle pattern – a textbook bullish formation. This week, the handle broke. We’re now testing A$87–A$89 and moving higher.
Here’s the brutal simplicity: When patterns form over 45 years, the measured moves aren’t small.
The maths says:
- First target: A$95–A$105 (conservative measured move)
- Second target: A$110–A$130 (extended measured move)
- Long-term bull case: A$150–A$200+ (multi-year scenario)
We’re at A$88.87 right now. That first target is knocking on the door.
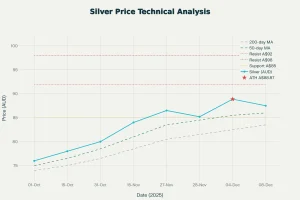
Silver Price Breakout – October to December 2025 (AUD)
Historical Precedent: What Happened in 1980
The last time silver broke out of a major 40+ year consolidation was 1980.
Here’s what actually happened: Silver went from $5 to $50 in roughly two years. That’s a 10x move in a 24-month window. Why? Geopolitical chaos (Soviet invasion of Afghanistan), dollar weakness, and central banks losing credibility on inflation control.
Adjust that 1980 move for inflation and today’s price levels? A$100–A$150 silver is the modern equivalent. Not fantasy. Just historical precedent.
The difference is, this time we’ve also got structural undersupply locking in. That makes the case even stronger.
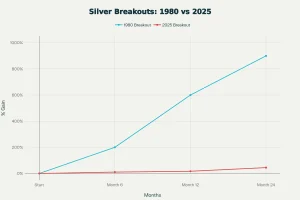
Silver Breakout Comparison: 1980s vs 2025 – Historical Pattern Precedent
Why The Structure Matters
Pull up the chart, and here’s what jumps out:
Silver’s above every major moving average. The 50-day and 200-day are both pointing north. This is textbook bullis, not noise, not dead-cat bounce. Real institutional buying.
Every corrective dip holds above previous lows. That’s the signature of money genuinely accumulating, not punting.
Volume confirmed the breakout above the previous resistance. This wasn’t retail-driven noise. This was real.
Supply vs Demand: The Structural Case
Here’s where the technical breakout meets fundamental reality.
Silver’s supply is getting crushed:
- COMEX inventories have been dropping steadily. We’re nowhere near 2022 levels.
- London vaults have been depleted by a third since June 2022. That’s serious drawdown, not cyclical noise.
- Mining production isn’t ramping up fast enough to meet demand. New mine development takes 5–10 years. We’re in a structural shortage window.
Meanwhile, demand is locked in:
- EV batteries need silver. As EV adoption accelerates, so does silver demand—and it’s not optional.
- Solar panels can’t be made without silver. The renewable energy build-out isn’t slowing down.
- Semiconductors and AI infrastructure are massive silver consumers. Cooling systems, circuitry, everything needs it.
- Medical devices use silver for its antimicrobial properties. Locked-in demand.
The gap between supply and demand is structural, not cyclical. Supply can’t respond fast to meet demand. That’s what creates persistent price support.
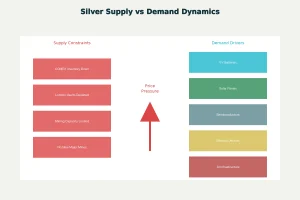
Silver Supply vs Demand: The Structural Case
The Levels That Matter
Here’s the operational framework.
Right Now To End of Year
Resistance:
- A$90–A$92 (short-term resistance, natural consolidation zone)
- A$95–A$98 (where some profit-taking happens)
Support:
- A$85 (the line that matters for short-term traders—4–5% risk below current levels)
- A$72 (the real circuit-breaker for longer-term holders—November low)
If silver holds above A$85, the pattern breakout is confirmed. If it breaks below A$72, longer-term players would reassess. Everything in between is just noise.
Next 3–6 Months
Targets:
- A$100–A$110 (first real measured move target)
- A$115–A$125 (extended target, if Fed keeps cutting)
Dips to watch: A$85, A$78, A$72.
12+ Months
Targets:
- A$110–A$130 (extended pattern target)
- A$150–A$200+ (long-term bull case, if macro supports it)
Silver Measured Move Targets – Pattern Breakout Price Projections
The Momentum Story (Short Version)
Silver’s moving higher with genuine strength, not exhaustion. There’s room to run before the technical indicators get stretched.
The gold-silver ratio is compressing—silver outperforming gold. That signals industrial demand is accelerating and allocators are rotating into the more volatile metal.
Bottom line: Momentum is bullish. There’s room to extend.
Gold: Why It’s Sitting Tight (And That’s Good)
Gold’s at A$6,350–A$6,800. Boring, yeah? That’s institutional accumulation. When big funds load up, they don’t push prices higher immediately. They quietly build positions in a tight band.
Gold and silver aren’t diverging. Gold’s supporting while silver leads the charge. They’re both going higher—silver’s just taking the lead because of structural undersupply.
This is healthy. This is bullish.
The Digital Gold Infrastructure Shift: Why Institutions Are Paying Attention
Here’s something most retail investors don’t know about: The infrastructure for trading precious metals is fundamentally changing.
The World Gold Council released a white paper in September 2025 on “Pooled Gold Interests and Wholesale Digital Gold”—essentially building a digital, fractionalized ownership system for physical gold and silver using distributed ledger technology.
What does this mean in English? Institutions can now allocate to precious metals faster, cheaper, and with less custody friction than ever before.
- Faster settlement: Hours instead of days
- Lower costs: Pooled structure reduces custody fees
- Fractional ownership: Smaller funds can now allocate without needing entire bars
- Transparent pricing: Electronic ledger eliminates intermediary markup
This infrastructure didn’t exist a year ago. Now it’s live. And institutions are starting to test it.
Why it matters for silver (and gold): Removing institutional friction = removing barriers to capital flows. When you make it easier for big money to allocate to precious metals, big money allocates. That’s structural bid support for prices.
Combined with the technical breakout and supply squeeze? This is the convergence moment.
What Could Go Wrong: The Risks (Be Honest With Yourself)
Here’s the flip side. If you’re going to position in silver, you need to know what could derail this thesis.
Hawkish Fed Surprise:
If the Fed signals tighter policy longer than markets expect, real yields could re-compress higher. That would hurt gold and silver. Support at A$85 (short-term) and A$72 (longer-term) would be tested.
Industrial Recession:
If global manufacturing slows harder than expected, industrial silver demand (EVs, solar, semiconductors) could soften. That would reduce structural support from supply constraints. A breakdown below A$72 would be the real warning sign.
Macro Shock:
Credit market stress, banking system tremor, something we’re not anticipating. These happen. Silver, like all risk assets, would get caught in the crossfire. Long-term bull case intact, short-term pain real.
None of these invalidate the 45-year pattern breakout or the structural supply story. But they’re the scenarios where A$85 support gets tested and dips to A$72 that become real risk.
Dec 10th: The Near-Term Catalyst
Fed decision coming. If they signal more cuts, silver could push toward A$95–A$105 before year-end. If they surprise hawkish, expect consolidation. Either way, the longer-term structure remains intact.
The Straightforward Take
Silver broke a 45-year pattern. The technicals are clean. Support is defined at A$85 (short-term) and A$72 (long-term). The macro backdrop supports higher prices. Supply is structurally constrained. Industrial demand is locked in. And institutional infrastructure for trading precious metals just got easier.
Does it go to A$100–A$110? Historically, yes. When? Probably 2026, with a shot at late 2025.
Is there risk? Obviously. Geopolitical shifts, Fed surprises, and industrial slowdown – all could trigger dips. That’s why defined support levels matter.
But the pattern, the technicals, the supply story, the institutional infrastructure shift—they all point the same direction.
Understanding what that direction is? That’s the information you need to make your own call.
Disclaimer:
This content is for educational purposes only and is not financial advice. It does not constitute a recommendation to buy, sell, or hold any security or asset. Past performance does not guarantee future results.
Always conduct your own research and consult a licensed financial advisor before making investment decisions.