

 0
0When the Jobs Report Broke, Gold Stopped Falling, And That Changes Everything
This week, a cluster of news events did not just move precious metals prices — they revealed a fundamental shift in how the market is treating gold and silver. From weak US labour data to central banks quietly rewriting the global reserve playbook, here is what actually changed this week and why it matters far beyond the price charts.
Week of 4 June 2026 | Gold Secure Bullion Market Commentary | goldsecure.com.au
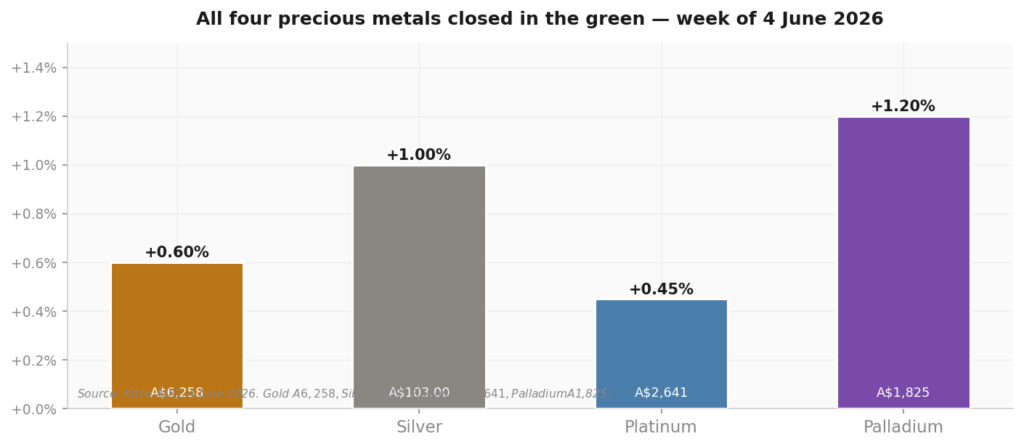
All four precious metals closed in the green this week.
SECTION 1
The Week’s Turning Point
The jobs report that stopped the bleeding
The catalyst arrived on Thursday morning. US unemployment claims came in at 225,000 for the week ending 30 May, well above the 213,000 the market had pencilled in. On the surface, it was a routine economic data release. But in the context of a precious metals market that had spent several weeks under pressure from a hawkish Federal Reserve narrative and a persistently strong US dollar, the timing was everything.
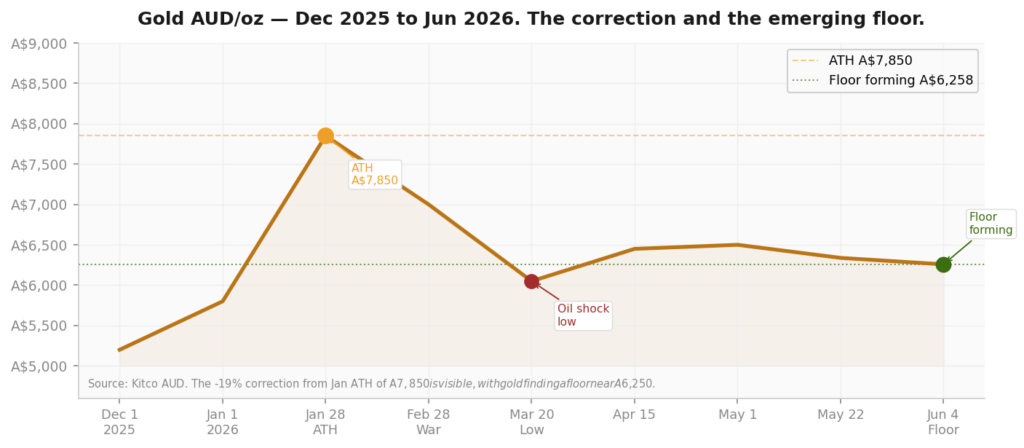
When the number crossed the wire, gold buyers who had been cautiously sitting on the sidelines re-entered the market with conviction. The metal climbed back above the A$6,250 level, reclaiming territory that had been surrendered during May’s sharp correction and held there through the session. That recovery was not incidental. It was a signal.
The buyers returning now are more deliberate. They are buying gold because the macro math is changing, not because they are scared.
For weeks, the dominant narrative had been that sticky inflation, running at roughly double the Federal Reserve’s target, would force the newly confirmed Fed Chair Kevin Warsh to keep rates restrictive or even push them higher. That narrative had been suffocating gold. Higher rates mean higher yields on bonds and cash, which increases the opportunity cost of holding gold, which pays nothing. The longer that story held, the more sellers had the upper hand.
The job numbers cracked that narrative open. Suddenly, the idea that the US economy could sustain prolonged rate hikes looked shakier. Market participants who had been short gold, or simply absent from the long side, had to reassess. The result was not a euphoric surge; it was something more durable: a measured, deliberate return to the metal.
Gold in AUD from December 2025 to June 2026. The -19% correction from January’s record high of A$7,850 is visible, with the metal now appearing to find a floor near A$6,250.
That behavioural shift – buyers returning not on fear or geopolitical panic, but on a recalibration of the rate outlook, is the most important development in the precious metals market this week. It suggests the correction that began in January may be entering its final phase.
SECTION 2
Safe-Haven Demand Evolution
Gold is being bought differently now
To understand what changed this week, it helps to understand what gold buying looked like three months ago. In January and February 2026, gold was being bought aggressively and indiscriminately. Every geopolitical headline, every escalation in the Middle East, every US-Iran confrontation, triggered immediate safe-haven flows. The metal hit a record high of around A$7,850 per ounce in late January as fear-driven buying dominated. Momentum traders piled in. Retail demand surged. The market was running hot.
That phase ended. The correction that followed was sharp and, at its worst, saw gold give back roughly 19% from those record levels. The panic buying unwound. Leveraged positions were liquidated. And for several weeks, even genuinely alarming geopolitical developments, including renewed confrontations around the Strait of Hormuz, produced muted or short-lived gold responses.
The Strait of Hormuz situation, through which approximately 20% of the world’s oil supply passes, remains unresolved. Iran’s insistence on controlling the waterway has kept the risk premium alive in energy markets. Oil is trading near elevated levels. But gold’s reaction to the Hormuz situation this week was notably different from its reaction in January. The metal did not spike on the headlines. Instead, it consolidated quietly and moved higher on the jobs data – a macro catalyst rather than a fear catalyst.
Fear-driven buying reverses quickly when the fear subsides. Macro-driven buying tends to be stickier. The market is transitioning from one to the other.
That distinction matters enormously. It tells us that the hot money and the momentum chasers have largely exited. The buyers returning now are more deliberate. They are buying gold because the macro math is changing, not because they are scared. That is a healthier and more durable safe-haven demand regime.
SECTION 3
Gold vs Silver: Two Different Market Stories
Same week, different messages
Gold and silver both climbed this week, gold settling near A$6,258 per ounce and silver pushing toward A$103 per ounce, but the forces behind each move are telling different stories.
Gold’s recovery this week was macro-driven. The jobs number, the dollar softening, the recalibration of rate cut expectations – these are the kinds of inputs that move institutional and central bank-level gold buyers. Gold is behaving primarily as a monetary asset right now: sensitive to yield differentials, dollar direction, and sovereign reserve policy.
Silver’s move was sharper in percentage terms, up 1.00% on the day against gold’s 0.60% and that divergence is instructive. Silver is responding to a different set of inputs entirely.
Silver has recorded a supply deficit for six consecutive years, with the shortfall projected to deepen to approximately 230 million ounces in 2026. Sources: World Silver Survey 2026.
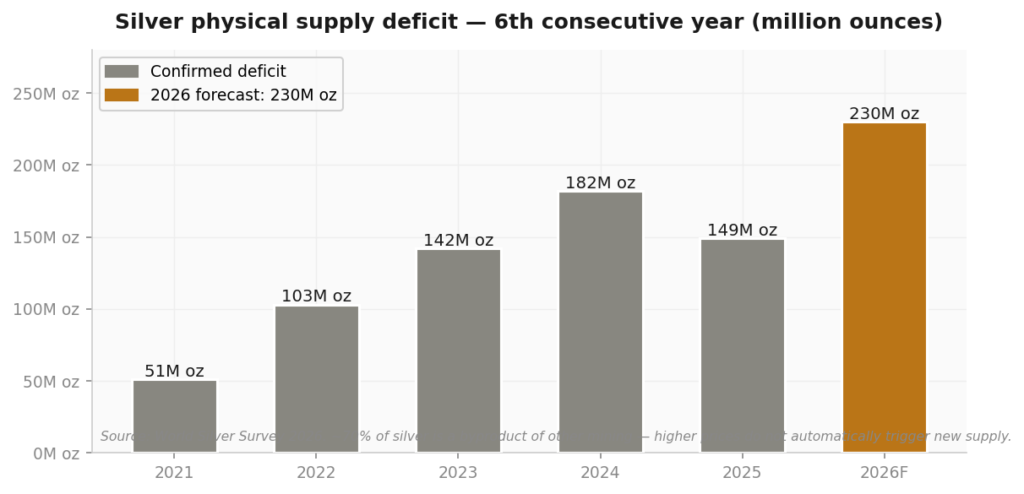
The structural supply story for silver is becoming impossible to ignore. The silver market is heading for its sixth consecutive annual supply deficit, with a shortfall of approximately 230 million ounces projected for the year. Approximately 70% of silver is produced as a byproduct of mining other metals, which means that rising silver prices do not automatically trigger new primary silver supply.
What is accelerating demand on the other side is the AI and clean energy infrastructure build-out. Data centres, power grids, solar panels, and electric vehicles, all require significant quantities of silver. This is industrial demand growing at a pace that the supply side structurally cannot match in the near term.
Silver is being bought by two very different groups this week, and that dual buyer base gives the current move more texture than a simple safe-haven trade.
Platinum and palladium also moved higher last week, platinum to around A$2,641 per ounce and palladium to approximately A$1,825, suggesting the broader precious metals complex is finding its footing, not just gold in isolation.
SECTION 4
The Macro Regime Shift
How the data changed the backdrop
Three forces converged this week to shift the macro backdrop for precious metals in a meaningful way. The first was the jobs data, the second was the US dollar, which remains near a two-month high but showed its first signs of stalling. A dollar that stops rising is not the same as a falling dollar, but for gold, the removal of incremental headwind is still a net positive.
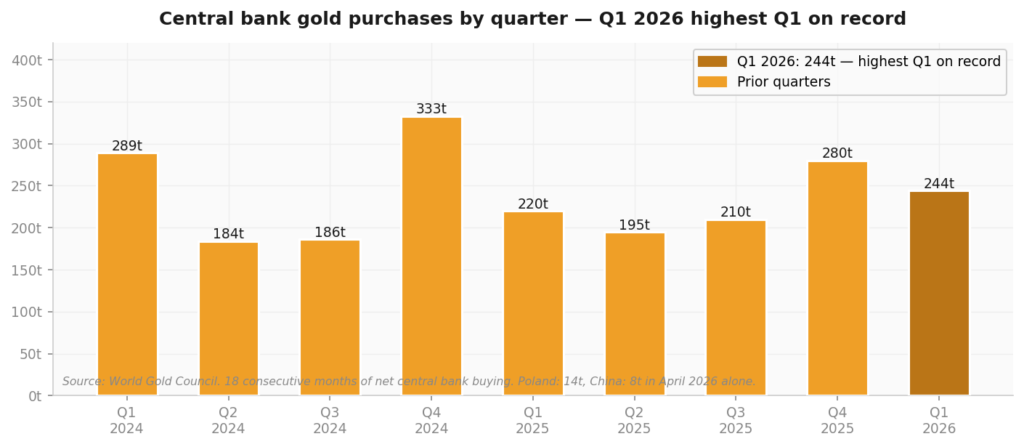
The third and arguably most structurally significant force was the central bank reserve data. Central banks bought a net 17 tonnes of gold in April, with Poland leading at 14 tonnes and China adding 8 tonnes, its highest monthly purchase since December 2024, extending a buying streak now running 18 consecutive months.
Central bank gold purchases by quarter. Q1 2026 recorded 244 tonnes — the highest first-quarter figure on record.
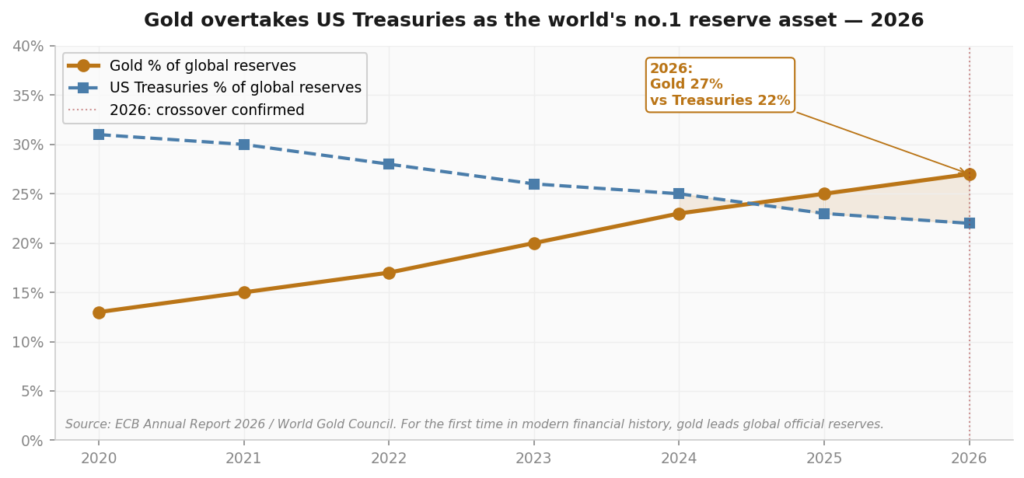
Beneath those buying numbers sits a data point that deserves far more attention than it has received. According to the European Central Bank’s annual report, gold now accounts for approximately 27% of total global official reserve assets surpassing US Treasuries, which sit at 22%. For the first time in modern financial history, gold is the world’s leading reserve asset class.
Gold’s share of global official reserve assets has grown from approximately 13% in 2020 to 27% in 2026, overtaking US Treasuries for the first time in modern history.
Central banks don’t trade in and out of reserve positions on a weekly basis. When they add gold at record pace, those flows provide a demand baseline that is largely immune to short-term macro noise.
Bond markets reflected some of this recalibration. Yields on the benchmark 10-year US Treasury note moved lower during the week, providing additional breathing room for gold. Lower long-term yields reduce the opportunity cost of holding bullion, and institutional allocation models that had been underweight gold relative to bonds begin to look more compelling at these levels.
SECTION 5
What Precious Metals Holders Need to Know
Translating the news into implications for physical allocation
The India story that broke this week deserves specific attention for anyone holding or considering physical gold. A report claimed that the Reserve Bank of India had sold approximately A$19 billion worth of gold reserves in the two weeks through 22 May — ostensibly to defend the rupee as the Iran conflict and elevated oil prices drained India’s foreign currency reserves. India’s central bank flatly denied the report, stating its physical gold holdings remain unchanged at 880.52 tonnes.
Whether the RBI sold or not is almost secondary to what the story reveals about the current environment. India is under significant currency pressure. Its foreign exchange reserves fell to a more than one-year low. The country is the world’s third-largest oil importer, and the combination of elevated oil prices and a weakening currency is creating genuine stress on the external accounts.
Gold is liquid, internationally accepted, and not subject to the counterparty risk that foreign currency reserves carry. The same logic driving central banks to accumulate applies to personal balance sheets.
For physical gold holders, this story is a reminder of exactly why sovereign-level gold holdings have become so strategically important. Gold is liquid, internationally accepted, and not subject to the counterparty risk that foreign currency reserves carry. When a central bank needs to defend its currency, gold is one of the few assets it can mobilize. The broader implication for individual investors is this: the same logic that is driving central banks to accumulate gold, currency debasement risk, sovereign debt stress, and geopolitical uncertainty applies to personal balance sheets.
For those watching the gold-to-silver ratio, currently sitting near historically elevated levels, silver’s deepening supply deficit and growing industrial demand base represent a structural argument for physical silver alongside gold. The sixth consecutive annual supply shortfall is not a talking point. It is a documented supply-demand imbalance that has not yet been fully reflected in price.
SECTION 6
Forward View: The New Precious Metals Narrative
What the market believes now and what it would take to change it
The precious metals narrative entering this week was defensive. Gold was in a correction. The Fed was hawkish. The dollar was strong. The safe-haven premium that had built up during January’s fear-driven rally was unwinding in an orderly but persistent way. Bears had the narrative. That narrative has not reversed in a single week, but it has shifted. The weight of evidence is now accumulating on the other side.
The new narrative has three components.
First, the macro floor is being rebuilt: The jobs data this week, combined with the trajectory of rate expectations, suggests the window for another Fed rate hike is narrowing rather than widening. When interest payments as a share of GDP are at levels not seen in comparable developed economies, the system’s tolerance for sustained high rates is genuinely limited. Markets are beginning to price that reality.
Second, the structural demand story has entered a new phase: Gold overtaking US Treasuries in the global reserve mix is not a headline that loses its significance over time. It represents a decade-long shift in sovereign reserve management that is still in progress, not complete. The World Gold Council’s survey data shows 95% of central bank respondents expect global gold reserves to grow over the next 12 months.
Third, silver’s supply-demand dynamic is approaching an inflection point: Six consecutive years of supply deficit, combined with accelerating industrial demand from the AI and clean energy build-out, are creating a structural argument for silver that is independent of gold’s monetary story.
Gold is no longer a fear trade. It is a structural trade. And this week, the market started positioning for that distinction.
What would challenge this narrative? A genuine resolution of the Iran-Hormuz standoff that brought oil prices back to comfortable levels would remove one pillar of safe-haven support. A strong US labour market report would revive the Fed hike narrative and likely push the dollar higher. And a significant reversal of central bank buying would undermine the structural demand floor.
None of those scenarios appear imminent. The Hormuz situation remains structurally unresolved. The US labour market is showing early signs of softening. And central banks globally have communicated, through both purchases and survey data, an intention to continue building gold reserves.
The precious metals market came into this week looking for confirmation that the correction was finding a floor. The jobs data, the central bank buying figures, the reserve asset displacement of Treasuries, and the muted but persistent geopolitical risk premium provided that confirmation, not loudly, but clearly.
Gold is no longer a fear trade. It is a structural trade. And this week, the market started positioning for that distinction.